I really love this data visualization by scientists at the University of California, San Francisco. Among other accomplishments, it deflates the myth of the solitary genius and shows the foundational work of basic scientists driving the “breakthroughs” that make headlines.
It took a network of 7,067 scientists to develop the cancer immunotherapy drug ipilimumab. And the logistical tail of discoveries spanned 104 years.
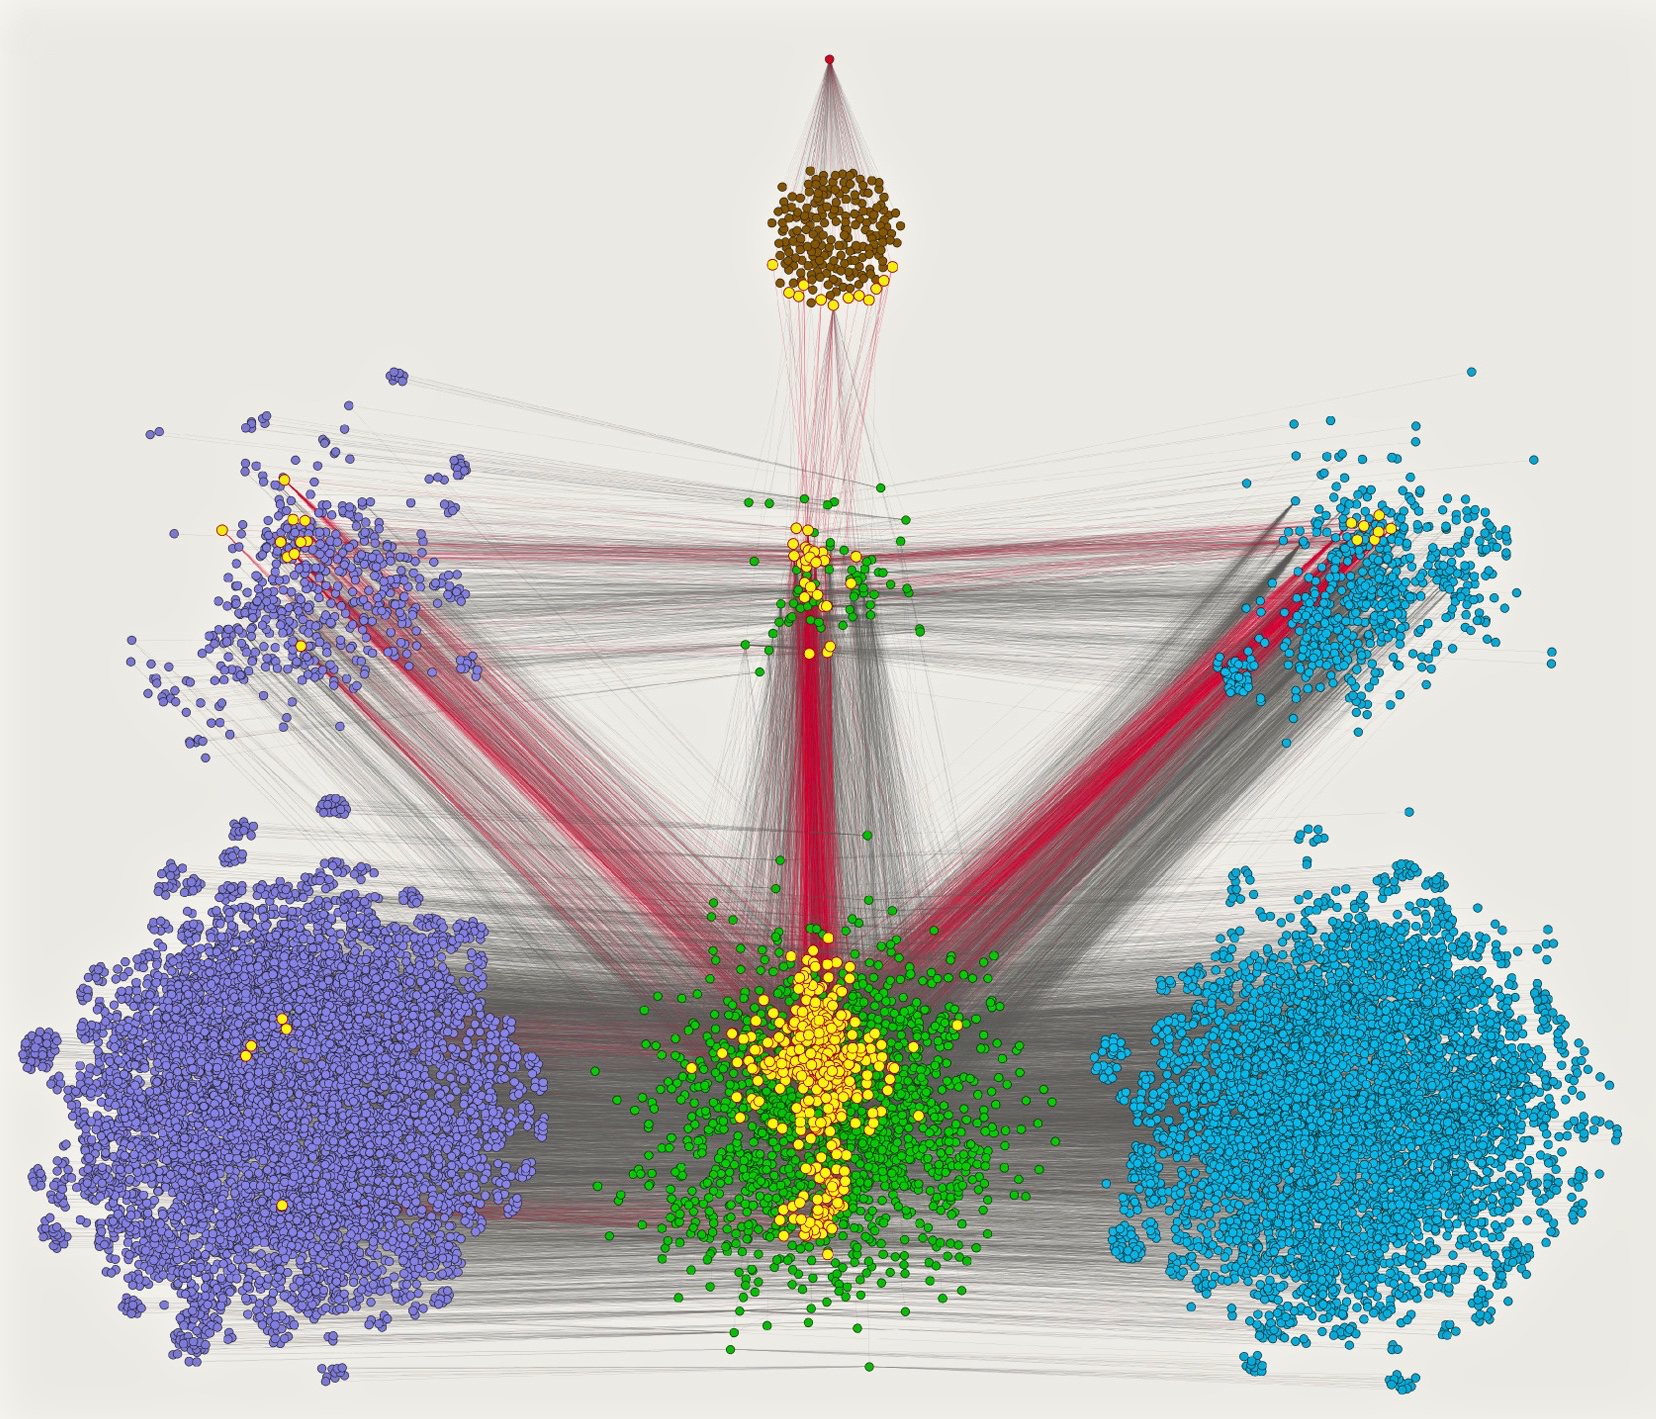
- The red dot at the apex of the cluster is the drug ipilimumab (Yervoy), the first treatment to stop advanced melanoma – and a hugely influential success in the field of cancer immunotherapy.
- Brown points represent clinical trials and regulatory filings documenting the effectiveness of the drug.
- Green points represent scientific papers cited in the clinical trials and regulatory filings, and, in turn, the papers cited by those publications.
- Purple points represent all of the authors of the papers.
- Blue points represent those authors’ institutional affiliations.
- Yellow points with red connecting lines highlight the most influential contributors to the network, their articles, and their institutions.
∞
Citation:
From Scientific Discovery to Cures: Bright Stars within a Galaxy, by R. Sanders Williams, Samad Lotia, Alisha K. Holloway and Alexander R. Pico, Cell (September 2015)

Thaank you for writing this